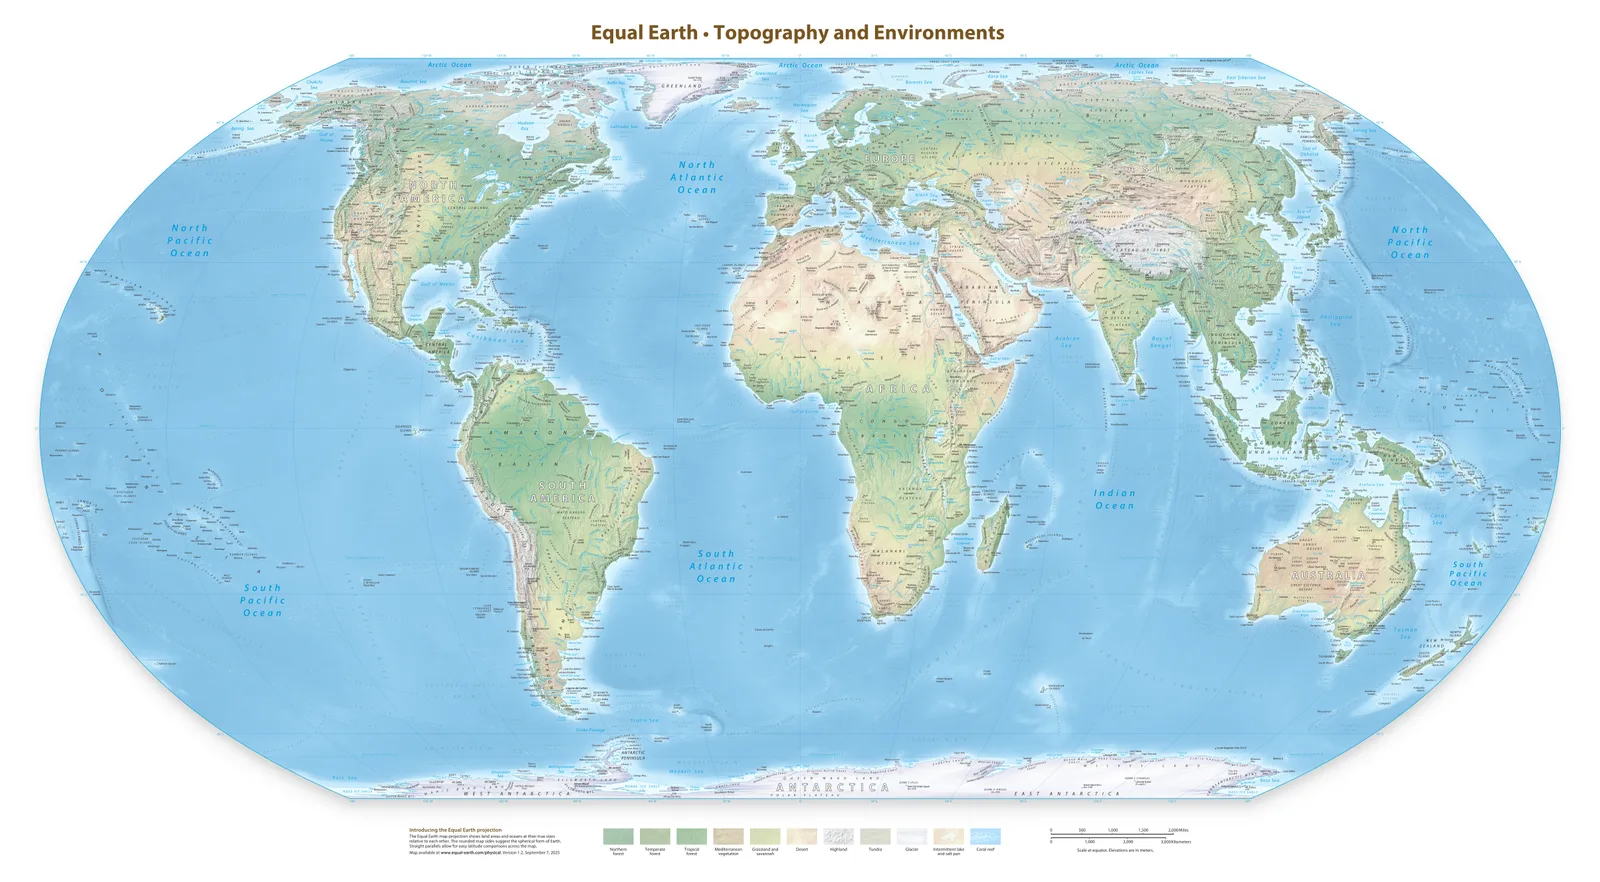
A large coloured area is not necessarily a large value.
A choropleth uses colour to represent a statistic. Its geographical footprint is a separate quantity. Equal Earth removes the extra area inflation of high latitudes, but a large, sparsely populated region still occupies more map space than a small, dense one. Land area is not population.
The little map lab
The same data. A different question.
Two fictional regions, two comparisons. Which has more libraries, in total or relative to population?
Total count · Libraries
A leads in total: 800 versus 300 libraries.
Fictional teaching data, not country statistics. A: 800 libraries, 8m residents. B: 300 libraries, 1m residents.
| Region | Libraries | Residents | Per million residents |
|---|---|---|---|
| A | 800 | 8,000,000 | 100 |
| B | 300 | 1,000,000 | 300 |
Total or per person?
Our fictional region A has 800 libraries and eight million residents. Region B has 300 libraries and one million residents. A leads in total; B leads per million residents, 300 to 100. Only the question changed.
Choropleth colours generally suit derived ratios; raw counts often suit proportional symbols. State the denominator clearly.
Section references[3]
Climate maps need the correct area weights.
Imagine equal-area measurement cells at the equator and 60°. On spherical Mercator the latter has a local area scale four times larger. Counting displayed pixels is therefore not automatically counting equal pieces of Earth. Equal-area display helps reading, but does not replace correct numerical analysis.
Section references[2]
Read the legend before the pattern.
Fixed intervals, equal numbers of regions per class and continuous colour scales may make the same data look different. Missing observations also need a separate symbol: “not measured” and “measured as zero” are different statements.
Five questions to take with you.
What is measured? When? Relative to what? Which property does the projection preserve? How are classes and missing values handled? For our library example, a table is enough to verify the ranking. A map becomes useful when your question also concerns spatial patterns.


